BI Step 5: CI/CD for Azure Data Factory

This is how I have setup for a very small/simple project using Azure Data factory:

When finished the work on dev environment, I merge it to the test environment (Don’t override the configuration files in each environment).

However, I still suggest the proper way as the link here:

https://levelup.gitconnected.com/continuous-integration-and-delivery-in-azure-data-factory-ea6a8a2d779d

Good luck.

Setup for BI Lessons learned

Source code: https://haiquangitvn.visualstudio.com/Lessons-BI

Datasource: https://haiquangitvn.sharepoint.com/lessons/DataSources

Power BI Group: https://app.powerbi.com/groups/5011761c-1af3-4816-b7ae-59a823ee4948

Power BI – Admin portal – Tenant settings – Allow service principals to use Power BI APIsUnapplied changes – Specific security groups (Recommended) -> Power BI APIs Security Group

BI Step 4: Handle Row Level Security

1. Allow AD users access to the database with full permission

Some backgrounds:

Basically, the users in a security group can access to everything in the databases if they are Active Directory admin

beepowerbigroup is Active Directory admin

Members:

Quang San Hai is a member in that group

Connect to SQL Server, using the account above

2. Allow AD users access to database with limit permission (Use this user for authentication in power bi)

The user in following example is allow to access to only 1 schema in the database:

3. RLS in Power BI

Lets build a model like this

RLS model

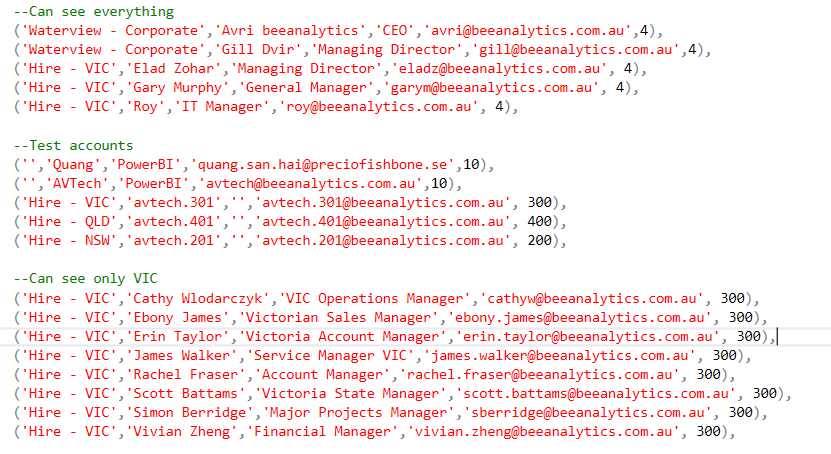
Some sample data for “rls Structure”:

Define the path

Some sample data for “rls RowLevelSecurity”

Some measures to test the RLS:

UPN = USERPRINCIPALNAME()

Apply the measures above to RLS:

And, as Patrik mentioned, you can also use GROUPS for Row-Level Security in Power BI.

Note: Don’t forget to add them to RLS in Power BI security settings:

Good luck!

BI Step 3: Prepare your database for the ETL Processes

This is an example for the ETL process, using Azure Data Factory

From the image above, you’ll see that we need to prepare 3 areas (schema) in the database: Landing, Staging and Current (or Data warehouse, the data marts can be in the same area with Current).

Landing tables can be the tables in step 2 (with some other tables), then staging tables are for transform the data (for a specific period) to prepare to merge it to current. Data marts will contain the data after calculated from current database.

Some schema names that I usually have:

  • etl_landing_db_source1: Landing tables from source1 database
  • etl_landing_db_source2: Landing tables from source2 database
  • etl_landing_db_source3_excel: Landing tables from excel
  • etl_staging_db: Staging tables
  • etl_current_db: Current/Data warehouse tables
  • etl_current_vv: Views on top of data warehouse tables
  • etl_landing_sp: Store Procedures to transform and moving data from landing tables to staging tables
  • etl_staging_sp: Store Procedures to merge data from staging tables to data warehouse
  • etl_current_sp: Store Procedure to calculate some specific business logics, such as “Build_MonthlyStockUtilisation”
  • rls: Tables to handle row level security, including Organization Structure and how to grant permission to each person.

Example for how to moving data from landing to staging:

This is an example for merge data from staging to current:

Note: The script above is for static data, with realtime data, you do not need to keep the history version of the records. Just delete and insert for the realtime.

BI Step 2: Detect important tables

From the Business Need, you can start thinking about some main entities, they can be Customer, Contract, Invoice, Sales Person …

When you have a CSV file from step 1, it’s time for you to detecting the important tables

  • Read data dictionary to understand the meaning of the field
  • Use Power Query Editor to collect all tables and all fields, like this
  • Add a custom column to identify if the field is related to that entity or not. For example, if you think field ACCT and THEIRREF are related to “Customer”, you can do like this:
  • Continue this step with other entities, and you’ll have something like this:
  • Then, group that list (remove fields) to detect if tables are related to entities (if any field in a table related to the entity, then that table is also related to the entity)
  • Next step is rank the tables to see which tables are important for the business analysic, for example ContItems occurs 10 times in your business logic:
  • From this step, you still need to combine with some other condition (such as how many rows of that table in the database) to make the list smaller

Hopefully this will help you some ideas about collecting the important tables for your BI project.

BI step 1: Application to convert Data Dictionary (none structured) to CSV (structured)

Let’s say that you have a dictionary like this

The application here will help you convert the text (CTR + A, then copy the text to a *.txt file) from that dictionary to a csv file

The CSV file will be similar to this:

From, that CSV file, you can easily search/view your table/fields in a better way:

Belive me, this will help you a lot in analyse data, to prepare for a BI project.

Background for Power BI Chiclet Slicer

Let’s say that you want to color your slicer to become something like this:

ChicletSlicerWithBackgroundColor

First, you need to create a color table for it:

TestColours =
UNION (
ROW ( “Index”, “1”,”RiskType”, “Low”, “ImgURL”, “https://htmlcolors.com/color-image/85e38d.png”, “ImgAsString”, “data:image/png;base64,iVBORw0KGgoAAAANSUhEUgAAAfQAAAH0AQMAAADxGE3JAAAABlBMVEUAAACF442kwz8WAAAAeklEQVR4nO3LMQ0AAAgDsPlXiwMmgo+0f7MnE9/3fd/3fd/3fd/3fd/3fd/3fd/3fd/3fd/3fd/3fd/3fd/3fd/3fd/3fd/3fd/3fd/3fd/3fd/3fd/3fd/3fd/3fd/3fd/3fd/3fd/3fd/3fd/3fd/3fd/3fd/33/wCFkN6z5EHC68AAAAASUVORK5CYII=” ),
ROW ( “Index”, “2”,”RiskType”, “Medium”, “ImgURL”, “https://htmlcolors.com/color-image/fdf542.png”, “ImgAsString”, “data:image/png;base64,iVBORw0KGgoAAAANSUhEUgAAAfQAAAH0AQMAAADxGE3JAAAABlBMVEUAAAD99ULpYmwIAAAAeklEQVR4nO3LMQ0AAAgDsPlXiwMmgo+0f7MnE9/3fd/3fd/3fd/3fd/3fd/3fd/3fd/3fd/3fd/3fd/3fd/3fd/3fd/3fd/3fd/3fd/3fd/3fd/3fd/3fd/3fd/3fd/3fd/3fd/3fd/3fd/3fd/3fd/3fd/3fd/33/wCFkN6z5EHC68AAAAASUVORK5CYII=” ),
ROW ( “Index”, “3”,”RiskType”, “High”, “ImgURL”, “https://htmlcolors.com/color-image/ff9005.png”, “ImgAsString”, “data:image/png;base64,iVBORw0KGgoAAAANSUhEUgAAAfQAAAH0AQMAAADxGE3JAAAABlBMVEUAAAD/kAUa1PO3AAAAeklEQVR4nO3LMQ0AAAgDsPlXiwMmgo+0f7MnE9/3fd/3fd/3fd/3fd/3fd/3fd/3fd/3fd/3fd/3fd/3fd/3fd/3fd/3fd/3fd/3fd/3fd/3fd/3fd/3fd/3fd/3fd/3fd/3fd/3fd/3fd/3fd/3fd/3fd/3fd/33/wCFkN6z5EHC68AAAAASUVORK5CYII=” ),
ROW ( “Index”, “4”,”RiskType”, “Critical”, “ImgURL”, “https://htmlcolors.com/color-image/ff0000.png”, “ImgAsString”, “data:image/png;base64,iVBORw0KGgoAAAANSUhEUgAAAfQAAAH0AQMAAADxGE3JAAAABlBMVEUAAAD/AAAb/40iAAAAeklEQVR4nO3LMQ0AAAgDsPlXiwMmgo+0f7MnE9/3fd/3fd/3fd/3fd/3fd/3fd/3fd/3fd/3fd/3fd/3fd/3fd/3fd/3fd/3fd/3fd/3fd/3fd/3fd/3fd/3fd/3fd/3fd/3fd/3fd/3fd/3fd/3fd/3fd/3fd/33/wCFkN6z5EHC68AAAAASUVORK5CYII=” )
)

ColorTable

in that table:

Index: Index of the color
RiskType: The meaning of color name in this case
ImgURL: https://htmlcolors.com/color-image/hex-color.png (hex-color can be the value of the color in hex format)
ImgAsString: Use https://www.base64-image.de/ to convert the color fron ImgUrl to string, this can help improve performance when use color as background.

Then, In ChicletSlicer visualization:

ChicletSlicerSettings


Risk matrix in power bi

There are a lot of questions in community for how to build a risk matrix in Power BI. I’ve seen some of them and realize that I can do it in another way. Here is how I solve it in my report:

1. Definition of Risk Matrix

My risk matrix is defined by 2 axes: Propability (Y) and Consequense (X), the graph I want to build is similar this:

RiskMatrixDefinition1

2. Number in cells

The number in each cell is the count of risk, based on the risk title. Formula for this measure column is like this:

StrRiskCount = if(DISTINCTCOUNT(AllRisks[Title]) = BLANK(), “”, “”&DISTINCTCOUNT(AllRisks[Title]))
Humm, you can see on the image above, the numbers are difference in each cell, how can we do that? Yes, we need to know the position of the cell first. I defined the position like this:
RiskMatrixDefinition
Best way to create a Grid metrix is using table
2022-01-03_15-36-36
With some format on the background:
2022-01-03_15-38-13

Continue reading “Risk matrix in power bi”

Excel REST API in SharePoint Online to PowerBI

Let’s says that you have an excel file located in a SharePoint library, and you know where to get data like this, and you want to display them in Power BI:

ExcelTableName

Yes, PowerBI can get data from an excel file, but how can we do that for excel online? Luckily, there are some example URL from excel services that we can use to fetch data from Excel:

https://docs.microsoft.com/en-us/sharepoint/dev/general-development/sample-uri-for-excel-services-rest-api

For PowerBI, Odata maybe the best one to selected

https://docs.microsoft.com/en-us/sharepoint/dev/general-development/using-odata-with-excel-services-rest-in-sharepoint

1. Get data from web (past odata link to the URL)

DataFromWeb

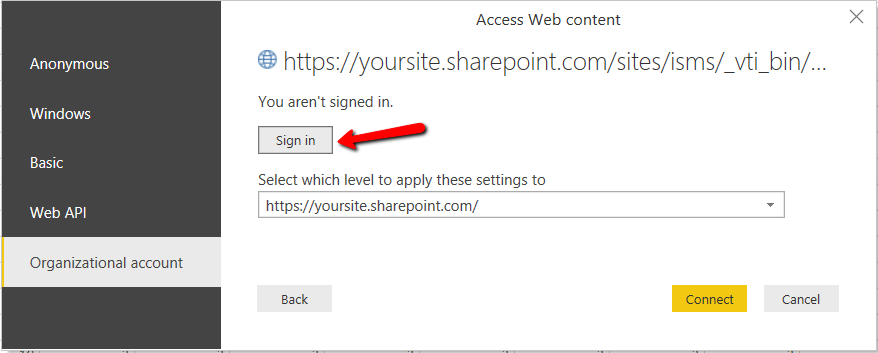
2. Sign in by your organization account

SignIn

3. Make sure you have data in Power Query Editor

PowerQueryEditor

Like this

QueryResult